"Datenschnorchel" (English: "data snorkel") is an interactive visualisation of metadata. The name comes from the German expression "Daten abschnorcheln", which is used for the interception of data.
Concerning the data retention in Germany and the global surveillance disclosures published with the help of Edward Snowden in 2013, the term metadata was used to appease concerned users. Metadata does not include the content of communication (e.g. the text in a letter) but contains the information “who communicates at what time, where and with whom” (e.g. the letter’s envelope).
The privacy and safety of users was declared safe and protected by government and intelligence agencies because no actual content is retained.
This argumentation did soothe many people because metadata is a very abstract construct. But the truth is that metadata can, in fact, reveal most accurate and private details of a persons life and behaviour.
With the Datenschnorchel we want to let everyone experience what metadata can reveal about a persons daily life - by using own data from social network accounts.
Our tool is still being implemented but it already works with Facebook accounts. Integrating other social networks such as Google+ or Twitter is planned.
Furthermore we proudly announce that the Datenschnorchel design recently won the Gold award from the International Institute for Information Design (IIID) in the category "student work".

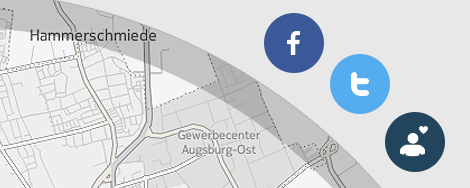
People using the visualisation can learn what metadata reveals about them - using data from their own social network accounts. Those networks are used to provide the following data types for the visualisation: Who? When? Where? With whom? How long? Analysing this data, some facts about the user can be assumed: Residence, workplace, leisure activities and relationships. We can cluster these information into two groups: location-based information and contact-based information. The first group is our focus and is designed with a map.
The map, being the most important view, is shown in a circle. This should give the user an impression of "looking through a keyhole", as if he is spying on himself.
Icons of the respective facts (residence, work, ..) are placed on the map and can be clicked for further information. Locations which are not shown in the current map frame are displayed at the border of the circle, providing a compass-like navigation. It is also possible to manually zoom in and out.
It is possible to log in with more than one social network account so that the Datenschnorchel can combine additional data and present the user a more detailed view of his behaviour (not implemented yet).
Additionally, the contact-based information can be activated by clicking the "contacts" button. The Datenschnorchel will give the user his 5 "best friends" by counting the amount of communication between the user and other users.


Sina Busch
Martin Kolb
Carsten Meier
